

Display data graph
TIBCO Cloud™ Metadata allows you to display your data in a graph. This is very helpful to see data relation, applications flows, lineage etc.
Open a data graph
The data graph can be open from :
- Table view mode after record selection
- Record view
Table view form
From the table view form, select one or multiple record(s) and click on the “Graph” button on the top left corner.
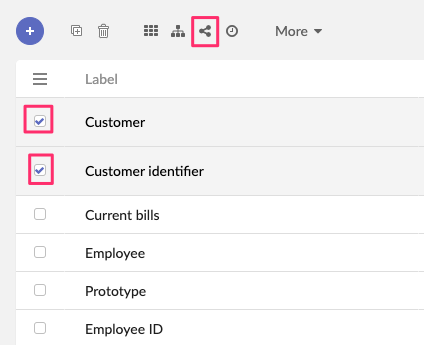
NB: The “Graph” button is not available on all tables.
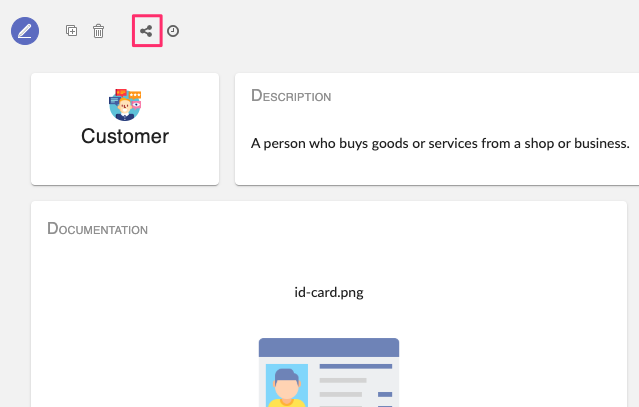
Record view
From the record view, click on the “Graph” button on the top left corner.
How to explore graph data
Once you have clicked on the “Graph” button the graph will be displayed.
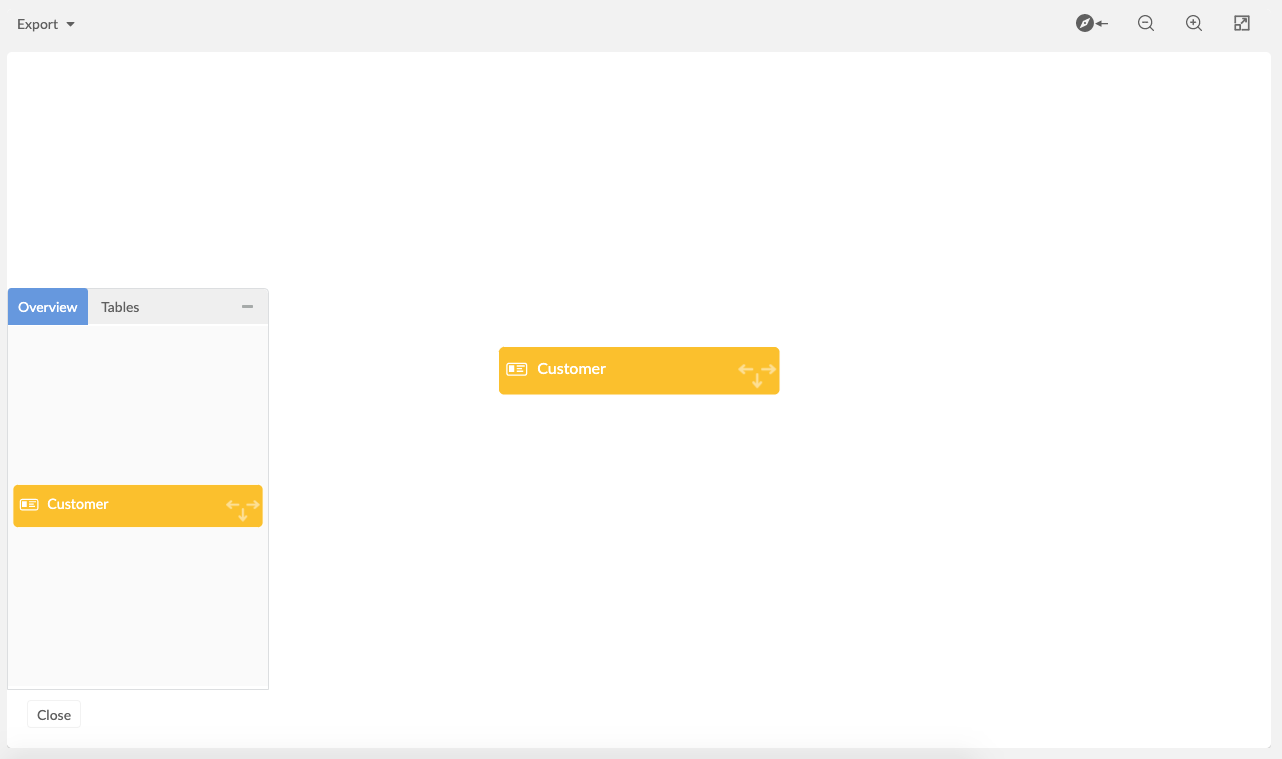
In this view, you can :
- Export the graph by clicking on the “Export” button

- Change graph orientation (expand to the left/expand to the right)
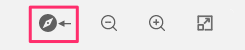
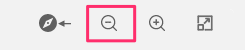
- Zoom-out
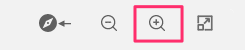
- Zoom-in
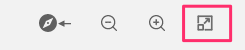
- Open the graph in full-screen mode (press “ESC” key to quit full screen)
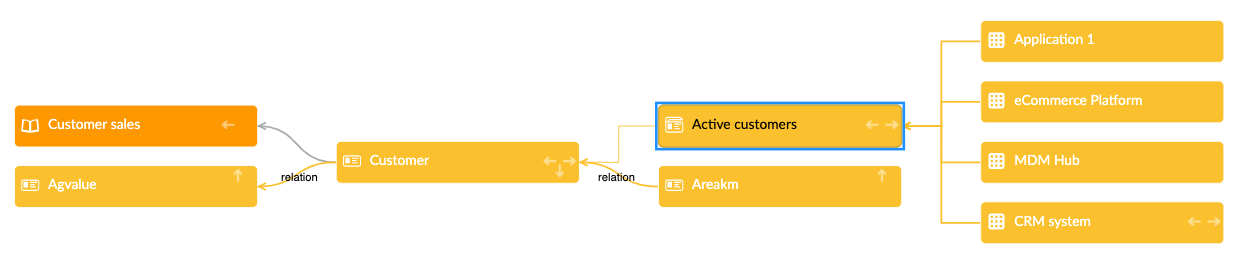
To explore the data there are arrows in the data node. You have to right-click on it to see options.
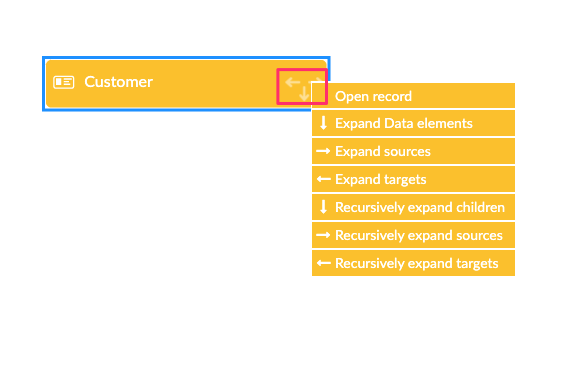
You can expand children, expand a particular record, collapse children, etc.
In the end you are able to see data relationships in a graph.
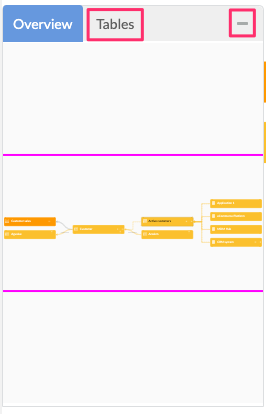
You can minimize the mini-map on the left if needed.
This mini-map help you to be oriented in the graph.
If you click on “Table” in the mini-map, you will see which tables are invoked in data visualisation.
Open the lineage graph
The lineage graph is only available on “Assets” and “Instances”. See Lineage.